
Restauromics Weekly Update
A Weekly Economics & Finance Briefing for Restaurant People. Issue: Monday, October 19, 2026
"This week everything with a gas tank got more expensive: your guests' commute, your distributor's truck, and, if the FTC waves it through, maybe even the one warehouse store that keeps your sales rep honest."
Prime Numbers
Financial trends that caught our attention:
34.2%
GASOLINE PRICE INCREASE, LAST 12 MONTHS
Energy overall is up 20.4%. September CPI, released October 14.
$6.29
RECORD WEEKLY U.S. DIESEL AVERAGE
Highest EIA reading since the series began in 1994, set in mid-September.
$15K
MEDIAN ANNUAL SAVINGS FROM SUPPLIER LEVERAGE
Independents who play Restaurant Depot against a broadliner, per the IRC.
Your Guests' Gas Bill Is Up 34%. Their Restaurant Spending Just Went Flat.
Story 01 · BLS / Consumer Edge
The September Consumer Price Index landed October 14, and the headline for your guests is the pump. Gasoline is up 34.2% over the past year and energy overall is up 20.4%, pushing all-items inflation to 3.7%. Gas alone jumped 9.1% in September on a seasonally adjusted basis.
Two days later, Consumer Edge published its Q3 card-spending read, and the money trail is clear. Spending at convenience, drug, and diet stores rose 14.9% year over year, helped along by higher gas prices. Full-service restaurants came in at 0.0%. Limited-service restaurants managed +0.2%, a full point slower than the first half of the year.
Now stack that against menu prices. Food away from home is up 3.5% over the past year and rose another 0.2% in September. When prices are up 3.5% and total dollars are flat, the math says somebody is coming in less often or ordering less when they do. Consumer Edge flagged back in June that high fuel costs were already squeezing budget-conscious diners hardest.
What This Means For You:
Your regulars did not stop liking you. They started paying $20 more every time they fill up. Look at your visit frequency, not just your sales, for the last eight weeks. If your Tuesday crowd is thinning, give them a reason that fits a tighter budget: a weeknight set menu, a lunch combo with a clear price, a kids-eat deal. Keep it simple and fixed so guests can do the math before they leave the house. And skip the next price increase if you can. With gas eating their wallet, your menu is the one bill they can actually cut.
Diesel Just Set a Record. Your Distributor Is Passing It Along One Surcharge at a Time.
Story 02 · Restaurant Dive / EIA
The U.S. average for on-highway diesel hit $6.285 a gallon in mid-September, the highest weekly reading in the Energy Information Administration's records going back to 1994. By late September it was around $6.38, up $2.63 from a year earlier. Supply disruptions around the Strait of Hormuz are the main driver, and nobody expects a quick fix.
That cost does not stay on the truck. Many of the biggest foodservice distributors tie their fuel surcharges directly to the national diesel price, so the line item on your invoice moves when the pump does. US Foods' CFO has said surcharges cover roughly 30% to 40% of its diesel cost, which means the rest is getting baked into case prices too.
Restaurant Dive's playbook for fighting back is built for chains, but most of it scales down: cut delivery days, consolidate orders, segment what you buy by volume and urgency, and reread freight terms that were negotiated when diesel was half the price.
What This Means For You:
Pull your last three invoices from every supplier and highlight every fuel, delivery, or minimum-order fee. Add them up. Most owners are surprised. Then make one call: can you drop from five deliveries a week to four, or from three to two, by ordering a little deeper on shelf-stable and frozen? Every delivery you cut is one surcharge you stop paying. Ask your rep whether the surcharge has a cap or a step-down when diesel falls. If they will not put that in writing, that tells you how long it is going to stay.
The Sysco and Restaurant Depot Deal Is Still Under Review. Your Best Price Lever Is on the Table.
Story 03 · Distribution Strategy Group / IRC
Six months after Sysco announced its roughly $29.1 billion bid for Jetro Restaurant Depot, the deal is still waiting on the Federal Trade Commission. The companies are answering the agency's requests for more information, no decision has been announced, and Sysco closed a large bond offering on October 6 to line up the financing. Sysco expects to close by the third quarter of its 2027 fiscal year. Restaurant Depot runs 167 warehouse stores in 35 states.
Independents have been loud about this one. The Independent Restaurant Coalition's survey found 75% of respondents buy from Restaurant Depot. Among operators who use both Restaurant Depot and Sysco, 76% have used one to negotiate against the other, and 70% of those got a price cut, a credit, or better service out of it. The median documented savings was $15,000 a year. And 92% said distributor consolidation has already made it harder to negotiate.
Sysco CEO Kevin Hourican has said he is confident the deal gets approved and has promised not to raise prices at Restaurant Depot afterward. Lawmakers including Senators Tammy Baldwin and Cory Booker have asked the FTC to dig in.
What This Means For You:
Whatever the FTC decides, the lesson is that competition between your suppliers is worth real money, and you should not have only one. This week, price your top 15 items at two sources, even if one is a local specialty distributor or a regional cash-and-carry. Write the gaps down and bring them to your rep. If the deal closes, you will want that price history to show what changed. If it does not, you just found your next $15,000.
A $201 Million Fund Wants Profitable, Founder-Led Concepts. Here Is What That Bar Looks Like.
Story 04 · Restaurant Dive
Savory Fund closed its third fund on October 14 at $201.5 million, above its $200 million target. The Utah-based firm plans to back eight or nine brands and has already deployed about 35% of the money, into names like Southblock, Bonrue Bakery, Hawkers Asian Street Food, and Zao Asian Grill.
The target is specific: profitable, emerging, founder-led concepts run by operators who have opened restaurants before and want to grow without losing what makes the brand theirs. Past bets show the scale they are going for. Swig went from 17 to 46 units with Savory's help, and Mo' Bettahs went from 6 to 56.
It is part of a broader pattern. Restaurant Dive also reported this week that beverage and growth chains like Swig, 7 Brew, and Dutch Bros were among the winning bidders for shuttered Salad and Go units. Capital is out there. It is just picky about where it goes.
What This Means For You:
Even if you never take a dollar of outside money, use their checklist on yourself. Can you show clean, monthly four-wall profit for every location? Do you know your unit economics well enough to explain them in two minutes? Could your concept run without you on the line every night? Those are the same questions a bank, a landlord, or a buyer will ask. If you have two or three profitable units and want to grow, get those numbers airtight now, while investors are actively looking for founder-led brands.
Quick Hits
Also Worth Watching:
- Bankrupt chain boxes are getting snapped up fast. A bankruptcy court approved the sale of more than 30 former Salad and Go units plus the brand's intellectual property for nearly $16 million, on top of 7 Brew's $123 million bid for 60-plus units last month. Swig, Dutch Bros, and Just Salad were among the buyers. If you have been eyeing a small drive-thru site, know that well-funded beverage chains are bidding on the same boxes. Read about the Salad and Go sale →
- Free money, short window. American Express and the International Downtown Association Foundation opened their fifth round of Backing International Small Restaurants grants, with more than $1.5 million going to over 100 independent restaurants in 15 cities across nine countries. Applications close November 16. Check whether your city is on the list before you spend time on the application. Read the grant announcement →
GEN Z HOUSE EDITORIAL
 Jason Molinari
Research Analyst, Popcorn GTM
Economics and Business Studies Student at New York University
Connect on Linkedin
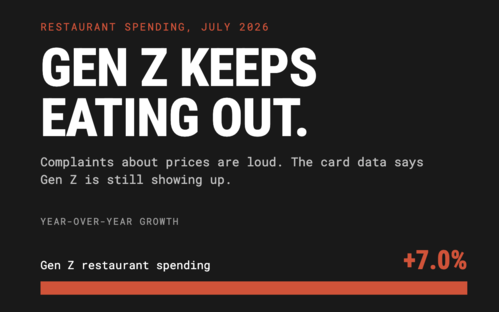
Gen Z Says Eating Out Is Too Expensive. Gen Z Keeps Eating Out.
Gen Z says eating out costs too much. Then Gen Z goes out to eat. Bank of America card data shows Gen Z restaurant spending up 7% year over year in July, almost double the rate of millennials, with bar spending up as much as 12%. Wage growth explains part of it. The rest comes down to why we go: the restaurant table is where our social life happens.
- Jason
+ + +

Restaurant Economics & Financial News Stories Delivered Weekly
The weekly economics briefing for independent restaurant operators, straight to your inbox. Free.
Previous Issues
Every week, archived.
- October 12, 2026: Starbucks reportedly explored buying Chipotle, Uber Eats agreed to buy ezCater for $2.3 billion, McDonald's franchisees balked at an $800,000 remodel bill while its pricing AI drew fire, and True Food Kitchen filed for Chapter 11.
- October 5, 2026: New SBA rules made restaurant buyouts harder to finance, diners are spending $100 a week and asking ChatGPT where to eat, September restaurant hiring cooled to just 10,800 jobs, and small-business health premiums are up 31% since 2022.
- September 28, 2026: One in three operators ran at a loss in the first half of 2026 as guests split into big spenders and deal hunters, USDA forecast restaurant prices outrunning groceries 3.5% to 2.4%, independents made up 68% of all summer openings, and fewer operators plan to raise menu prices while more tighten up the walk-in instead.
- September 21, 2026: The Fed raised rates for the first time since 2023, 380 independents told James Beard that wage growth slowed while AI interest climbed, USDA forecast egg prices to fall 30.7% in 2026, and OpenTable data showed diners chasing happy hour deals and last-minute tables.
- September 14, 2026: A merchant cash advance's effective annual rate can hit 100%, ground beef hit $6.89 a pound with more increases forecast, operators are holding headcount steady instead of hiring or cutting, and New York eliminated its seasonal outdoor dining teardown rule for good.
- September 7, 2026: Independent restaurants and bars outgrew chains on summer sales growth, casual dining reclaimed value from fast casual as QSR prices caught up, Canada's retaliatory tariffs hit coffee, cocoa, and seafood imports, and most operators believe AI gives them an edge but few can prove it improved profit.
- August 31, 2026: Florida's minimum wage hit its final scheduled step toward $15, a bipartisan swipe fee bill picked up an unlikely presidential endorsement, 2026 data put real numbers behind restaurant insurance costs, and delivery apps' advertised commission rates turned out to understate the real number by 10 to 15 points.
- August 24, 2026: Whataburger's $4 value menu escalated the QSR price war, a 38-store Moe's franchisee filed Chapter 11 on five-year-old COVID debt, Grubhub's FTC settlement is paying out $23.8 million to 640,038 drivers and diners, and tightening SBA lending met compressing franchise valuations in a new 1H26 report.
- August 17, 2026: A cyclospora outbreak crashed lettuce prices 16.4% in a month, the average restaurant is now short five workers, Cava grew same-store sales 9.7% by underpricing inflation on purpose, and a wave of immigration legislation is reshaping the labor pool in real time.
- August 10, 2026: A Salmonella outbreak tied to one jalapeño grower hit Chipotle, Qdoba, and Sweetgreen, Salad and Go closed all 70 stores overnight under bankruptcy, 71% of operators are raising prices even as low-income households absorb the most pressure, and diners are showing up for happy hour and spontaneity again.
- August 3, 2026: A 13-week cash flow forecast beats a monthly close, a major food traceability deadline moved to 2028 but the underlying risk did not, 4 in 10 guests say they are dining out less while fast casual keeps winning traffic, and Taco Bell's loyalty playbook outran a lettuce recall.
- July 27, 2026: A $38 billion swipe fee settlement barely moves the needle, avocado prices jumped 89%, a lettuce recall triggered nationwide lawsuits, and No Tax on Tips is finally final.
- July 20, 2026: Beef prices hit a record high as screwworm shut down Texas ports, independents need 29% more sales than 2019 just to break even, GLP-1 users are ordering smaller and spending less, and third-party delivery's true cost runs 30 to 40% of order revenue.
- July 13, 2026: Ground beef hit a record $6.90/lb, delivery apps' true cost is closer to 40%, a second Hardee's franchisee filed bankruptcy, and 256 independents split $1.28M in grants.
- July 8, 2026: 42% of operators not profitable, Jersey Mike's IPO economics, drive-thru AI, and 40 independent restaurants win $25K grants.